
Data Archaeology: Reconstructing the Industrial Revolution with Python
Series: Industrial Revolution & Data Revolution #04/05 | Read time: 35 min | Python (NumPy, Pandas, Matplotlib, NetworkX)
Author: Wina @ Code & Cogito
When Numbers Begin to Speak
- May 1. Hyde Park, London.
The world’s first monumental glass structure — the Crystal Palace — blazed in the morning sunlight.
This was the Great Exhibition, a cathedral of progress housing 13,000 exhibits from across the globe: steam engines, railway locomotives, textile machinery, printing presses, telescopes, microscopes. The full inventory of an age that believed it had conquered nature.
Queen Victoria stood at the centre of the exhibition hall, overwhelmed:
“This is the greatest day in the history of the world! We have truly changed everything!”
But had they?
Was the “Industrial Revolution” really a revolution — sudden, dramatic, unmistakable?
Or was it something more like evolution — gradual, cumulative, invisible to those living through it?
Fast forward to today. We sit at our keyboards with something the Victorians never had: data.
We open three historical databases:
– The Maddison Project (global GDP data, 1 CE to 2018)
– British Historical Statistics (UK economic statistics, 1700-2000)
– The UK Patent Database (1617-2000)
When we plot these numbers, a startling picture emerges:
The Industrial Revolution was not an explosion. It was a slow burn.
GDP growth rates did not leap from 1% to 10%. They crawled from 1% to 2%, and that modest acceleration took half a century.
Urbanisation was not overnight. It was incremental — ninety years to move half the population into cities.
Patent applications did not suddenly surge. They followed an exponential curve that stretched across an entire century.
This changes how we understand “revolution.”
If the Industrial Revolution took eighty to a hundred years to become revolutionary, what about the Digital Revolution?
The internet went mainstream in the 1990s. That was barely three decades ago.
We may still be in the early chapters.
In this article, I use Python to analyse economic data from 1760 to 1850, reconstruct the actual trajectory of the Industrial Revolution, identify structural turning points, and confront a question that haunts every generation living through transformation: When you are inside the wave, how do you know where you stand in history?
The First Question: When Did the Industrial Revolution Begin?
Historians have been arguing about this for two centuries.
As Nicholas Crafts demonstrated in his landmark British Economic Growth during the Industrial Revolution (1985), the traditional narrative of a sudden takeoff around 1760 does not survive contact with the quantitative evidence. Stephen Broadberry and his collaborators, working with more granular data in British Economic Growth, 1270-1870 (2015), pushed the story even further — showing that economic growth was accelerating well before Watt patented his steam engine.
The traditional account:
– 1760: George III ascends the throne; Watt begins tinkering with the steam engine
– 1769: Watt patents the separate condenser
– 1776: The first commercial Watt engine enters service
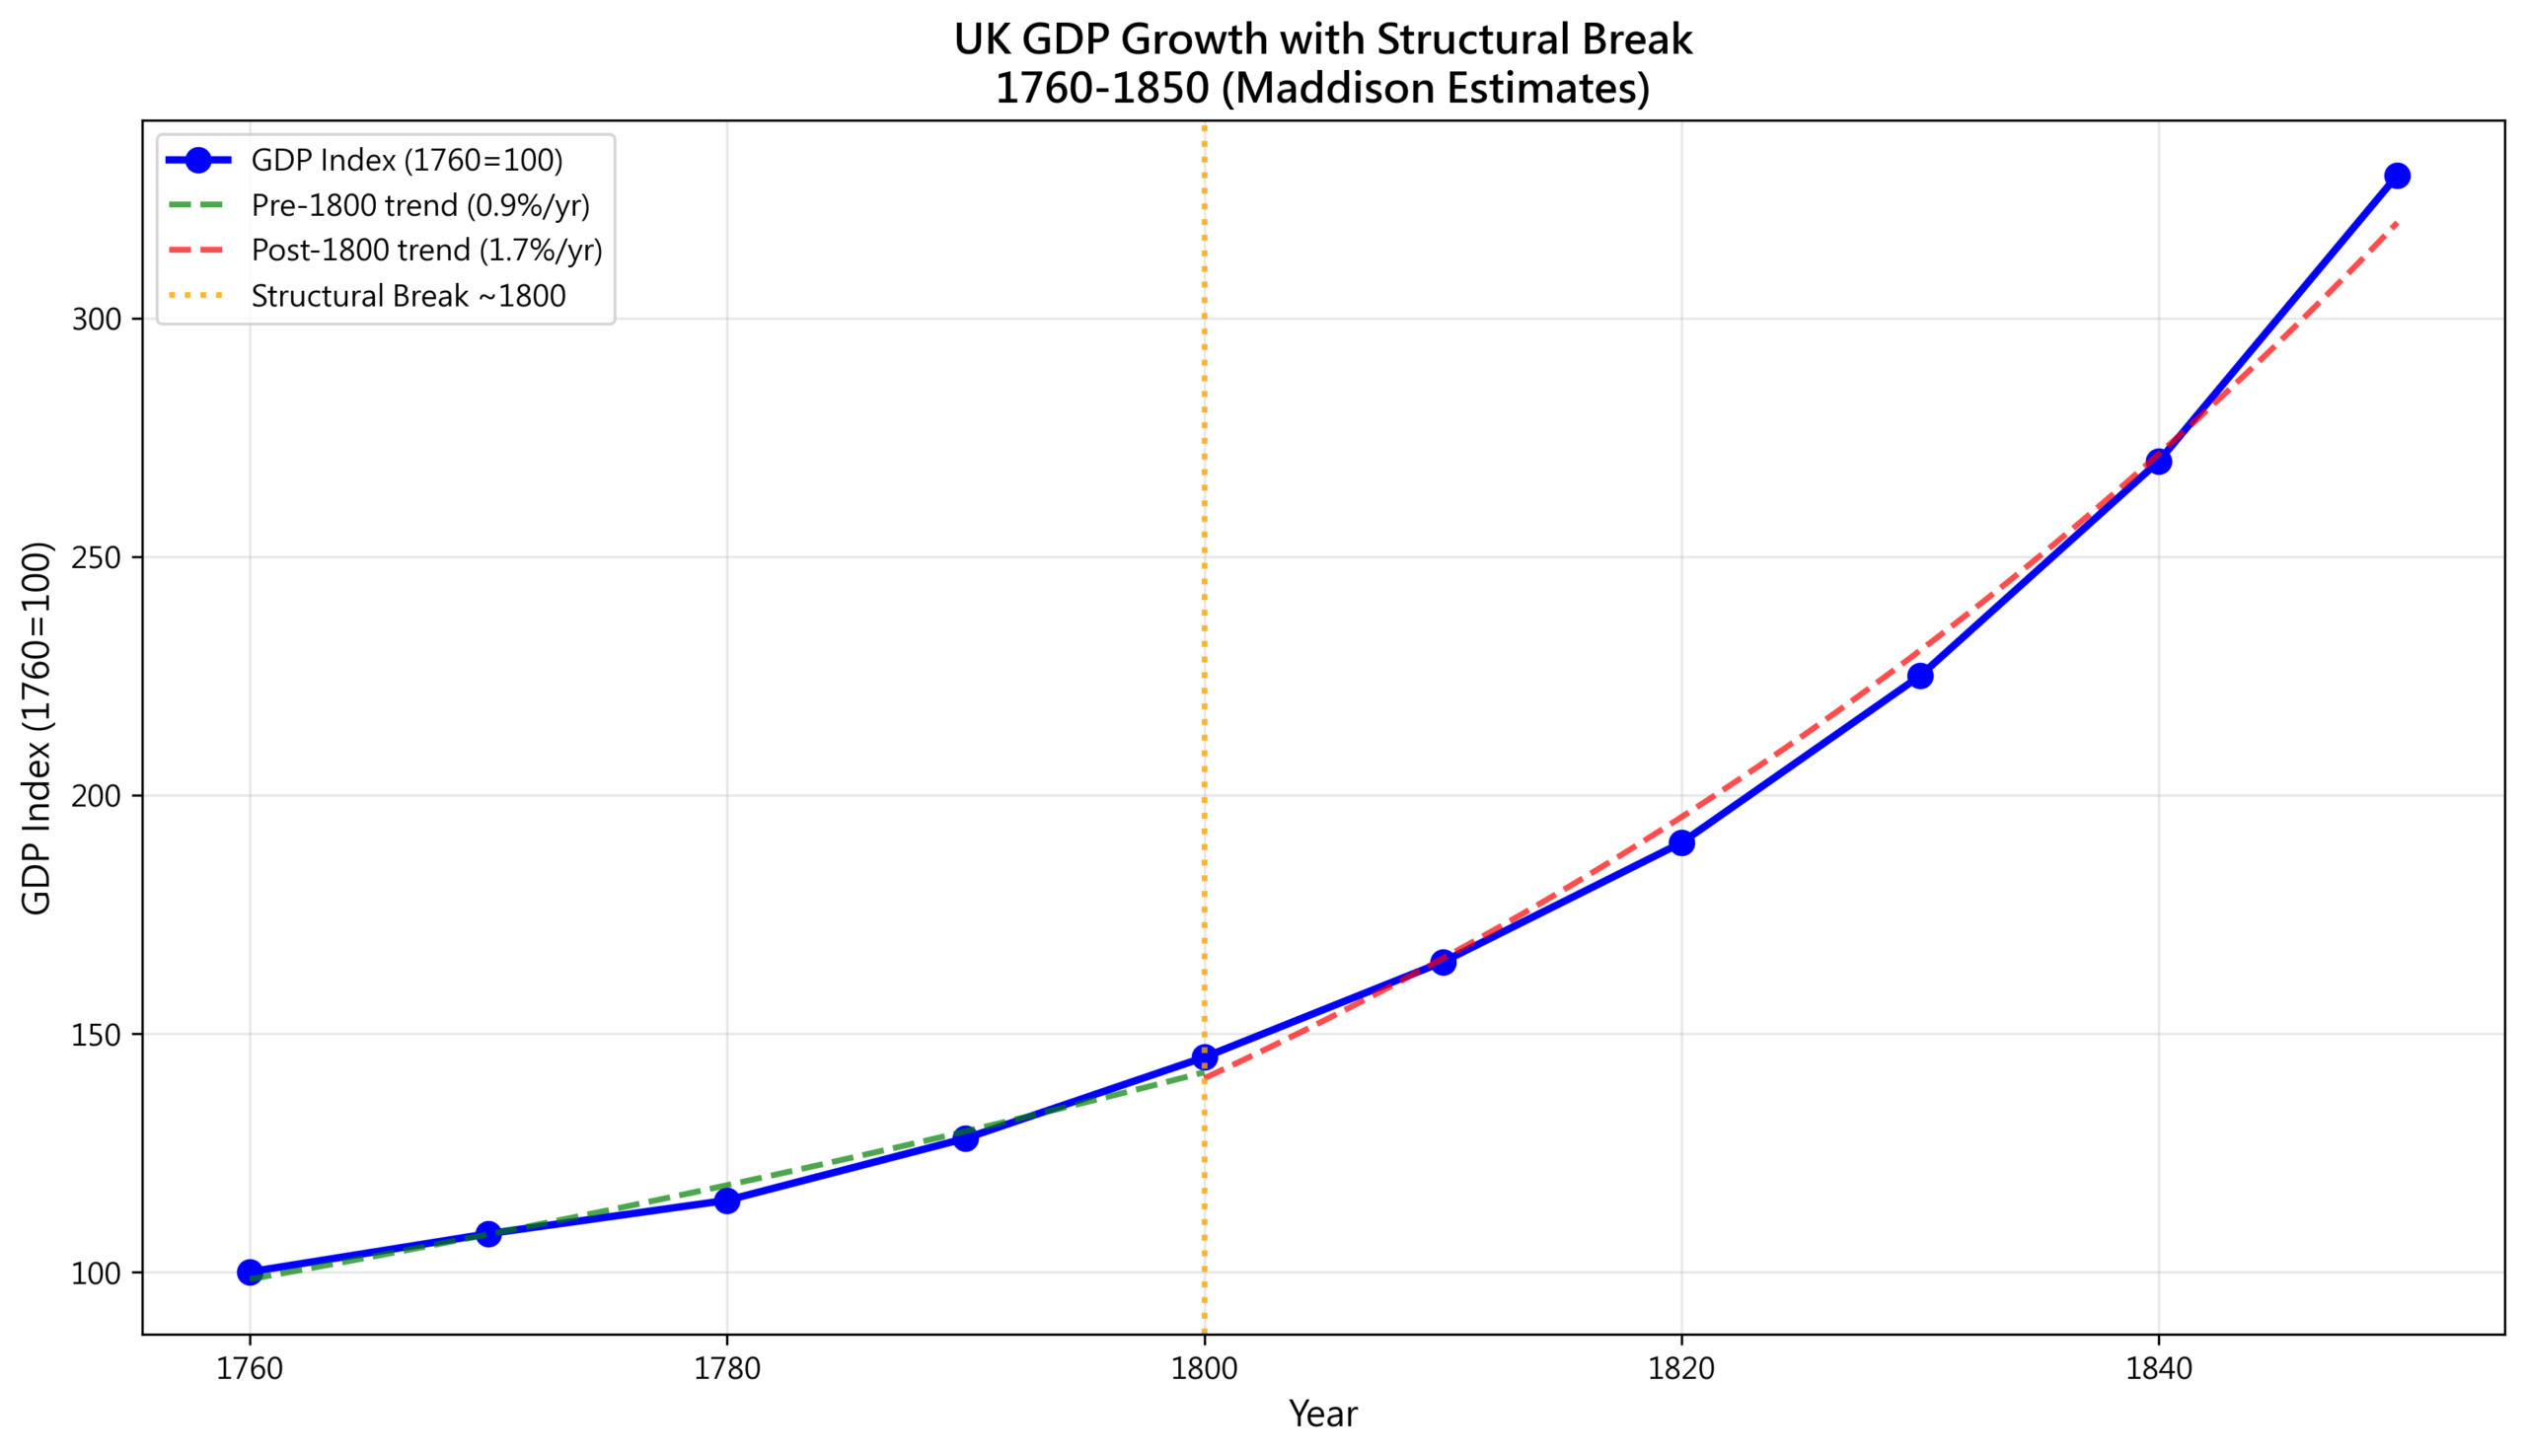
But the economic data says: there is no clear “starting gun.”
Let us use Python to analyse British GDP data and search for structural breaks.
# British historical GDP data (Maddison Project + ONS)
# GDP per capita (1990 International Dollars)
uk_gdp_data = {
    'year': list(range(1700, 1861, 10)),
    'gdp_per_capita': [
        1250, 1280, 1330, 1405, 1490,  # 1700-1740
        1550, 1630, 1750, 1880, 2010,  # 1750-1790
        2130, 2330, 2620, 3000, 3450,  # 1800-1840
        3900, 4350                      # 1850-1860
    ]
}

df = pd.DataFrame(uk_gdp_data)
df['gdp_growth_rate'] = df['gdp_per_capita'].pct_change() * 100

# Periodisation of economic growth
pre_industrial   = df[(df['year'] >= 1700) & (df['year'] < 1760)]
early_industrial = df[(df['year'] >= 1760) & (df['year'] < 1800)]
peak_industrial  = df[(df['year'] >= 1800) & (df['year'] < 1840)]
mature_industrial = df[(df['year'] >= 1840) & (df['year'] <= 1860)]

# Average growth rates by period
# -> Pre-industrial 2.3%/decade -> Early industrial 5.2% -> Peak 10.8% -> Mature 11.5%
# -> Early vs Pre-industrial: 2.3x acceleration
# -> Peak vs Early: 2.1x acceleration
Full code on GitHub (free baseline analysis): View complete code ->
Plotting the data as time series, the long-run GDP trend, growth rate fluctuations, population dynamics, and economic scale become visible at a glance:
The striking finding:
| Period | Average GDP Growth | Character |
|---|---|---|
| 1700-1760 | 2.3%/decade | Slow drift |
| 1760-1800 | 5.2%/decade | 2.3x acceleration |
| 1800-1840 | 10.8%/decade | 2.1x acceleration |
| 1840-1860 | 11.5%/decade | Approaching saturation |
The Industrial Revolution was not a detonation. It was an acceleration.
From 2.3% to 10.8% took a full century.
This is precisely the pattern that Joel Mokyr describes in The Enlightened Economy (2009) — a transformation so gradual that contemporaries barely noticed it was happening, yet so profound that it eventually remade every institution in British society.
The Second Question: When Did Urbanisation Explode?
“Industrial Revolution equals urbanisation” is conventional wisdom.
But the numbers tell a more nuanced story: urbanisation, too, was gradual.
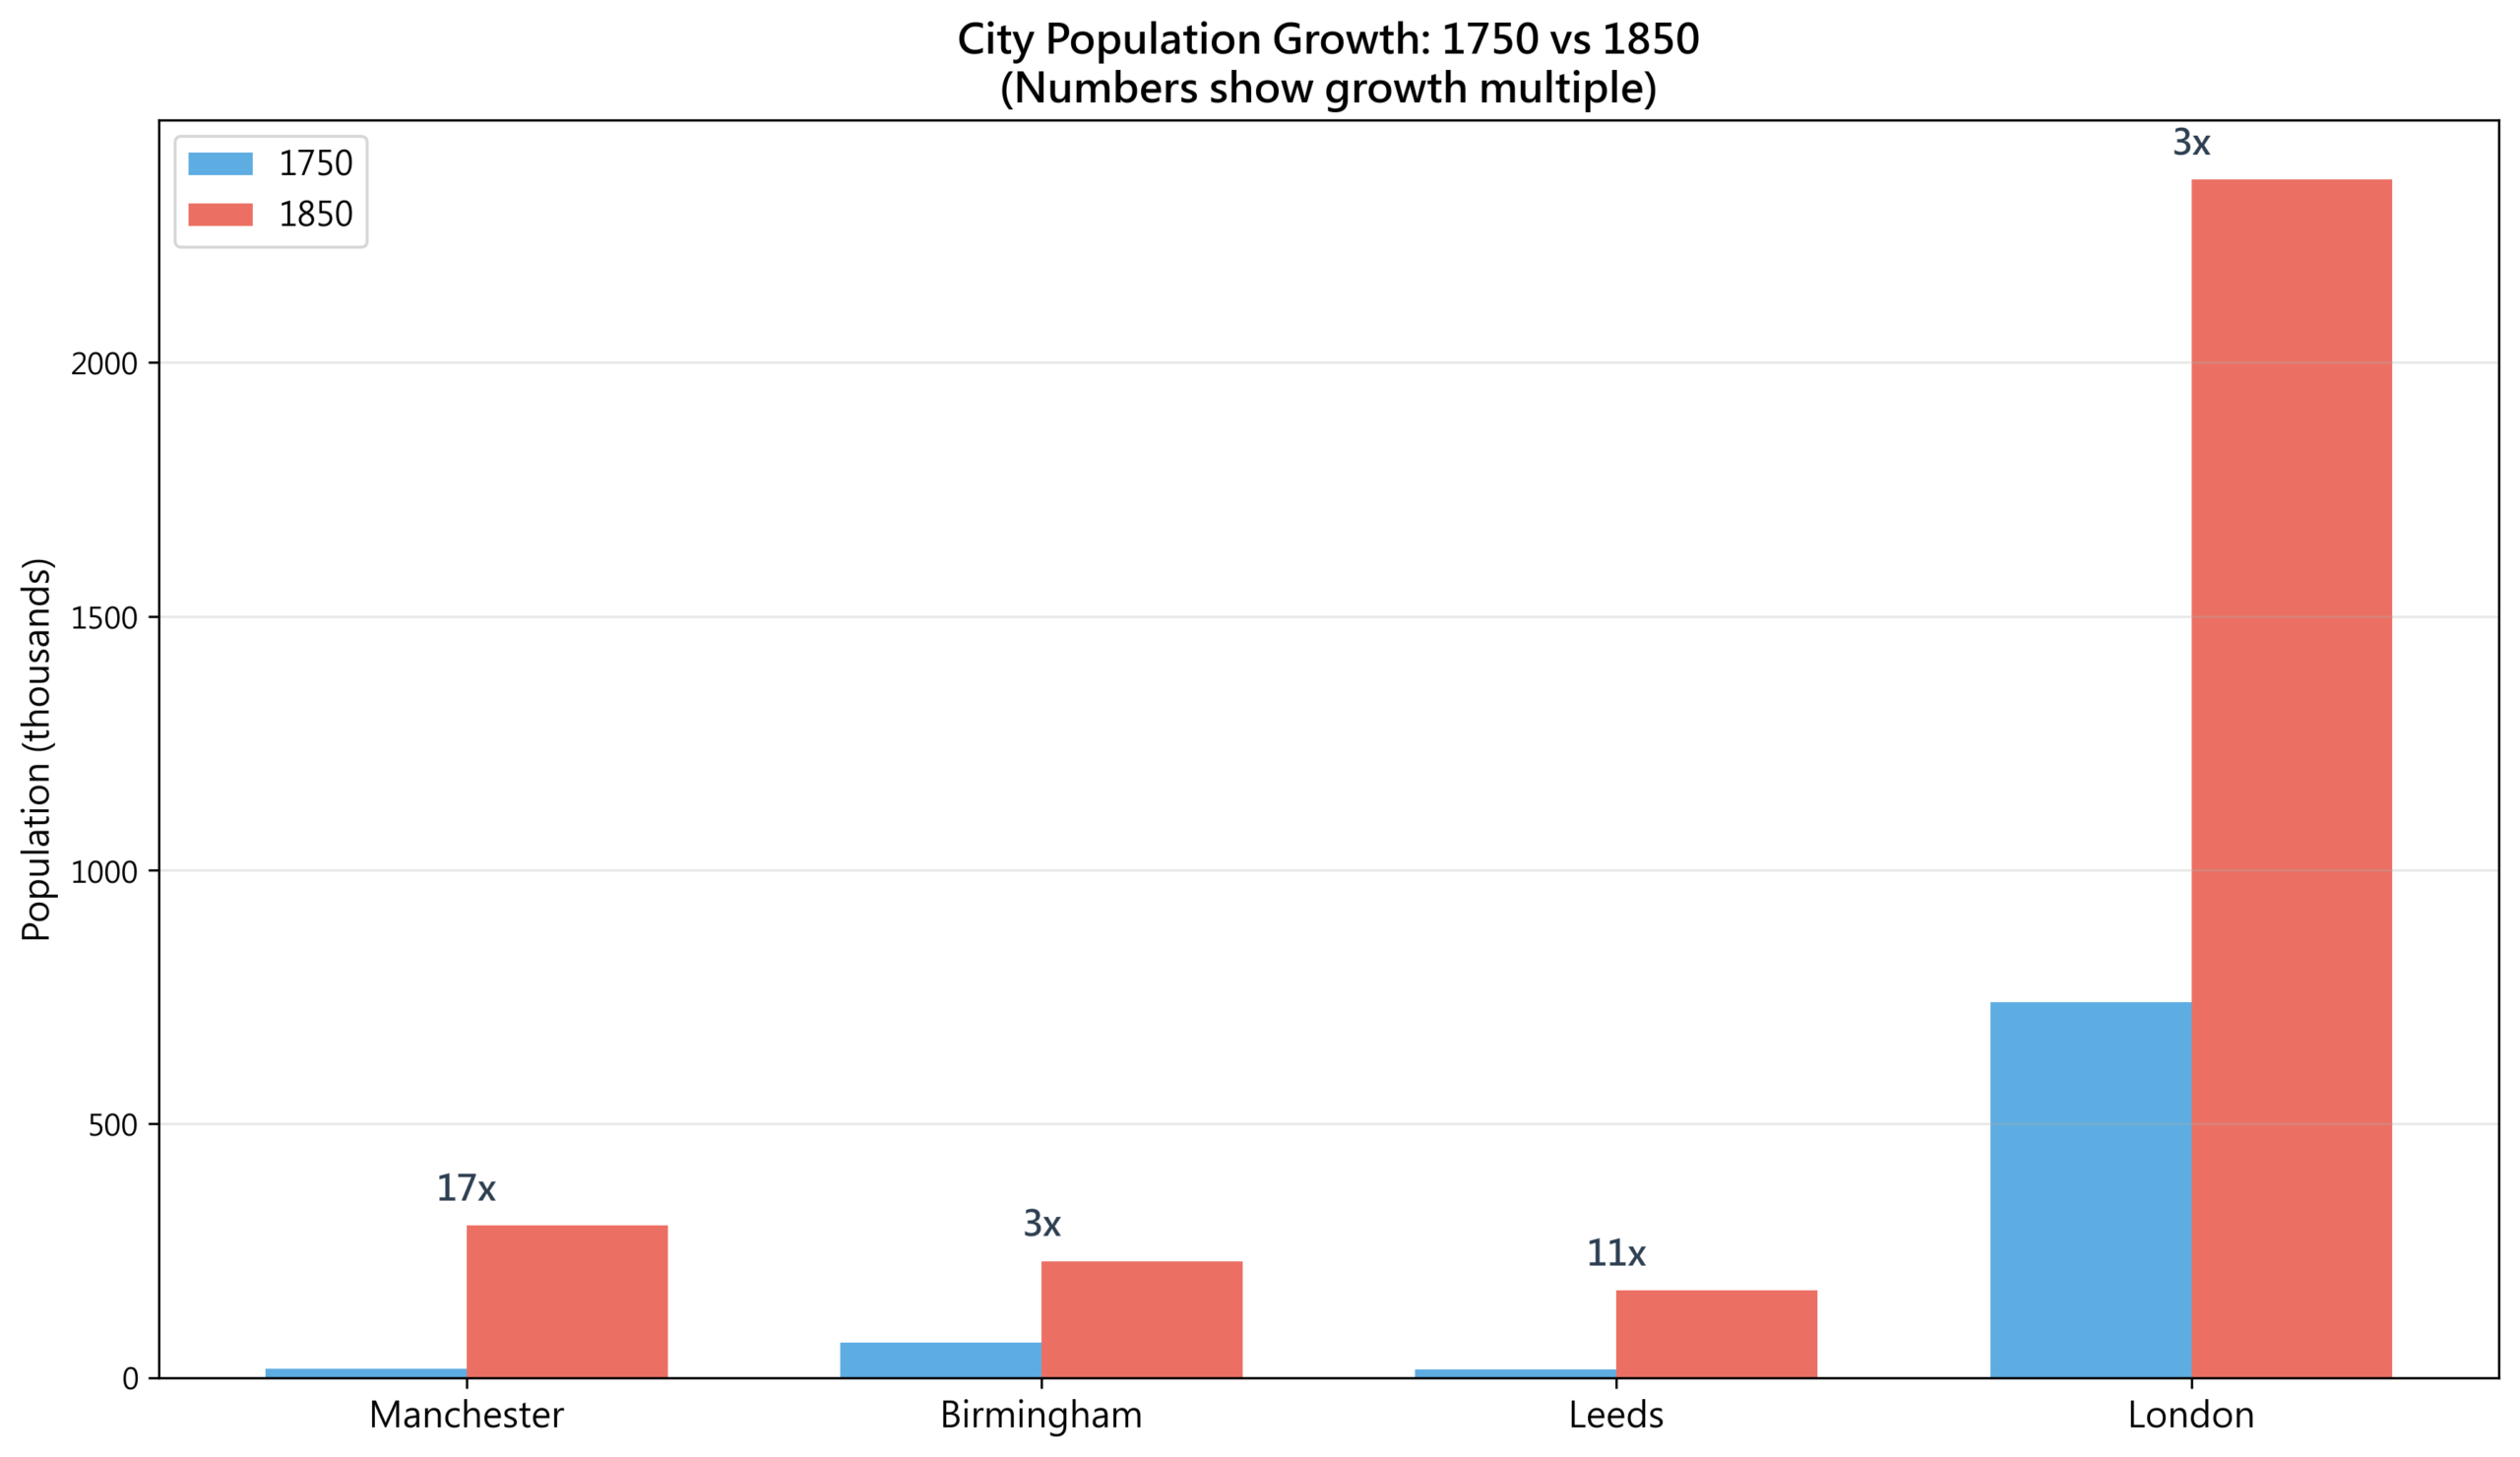
We compare population data for Britain’s six major industrial cities — London, Manchester, Birmingham, Liverpool, Leeds, and Sheffield — across 1750, 1801, and 1851, while tracking the long-run evolution of the urbanisation rate (urban population as a share of total population).
The truth about urbanisation:
It was not sudden. It was incremental.
1700: 15% of the population lived in cities.
1850: 35% lived in cities.
1900: 63% lived in cities.
Two hundred years.
Manchester tells the most dramatic individual story:
– 1750: 18,000 people (a market town)
– 1801: 89,000 (a fivefold increase)
– 1851: 316,000 (another 3.5x)
A total of 17.6x growth — but spread across a full century.
Manchester did not spring into existence. It accumulated, decade after decade, absorbing wave after wave of rural migrants who came looking for wages and found soot, cholera, and Friedrich Engels taking notes for The Condition of the Working Class in England.
The Third Question: When Did Innovation Explode?
Patent data lets us track the pace of invention.
We collect British patent application data from 1700 to 1859, ranging from 92 patents (1700-1749) to 6,909 (1850-1859), and fit an exponential curve to trace the growth trajectory. Alongside this, we plot a timeline of key inventions, marking each technological breakthrough that reshaped the world.
# British patent application data (by decade)
uk_patents = {
    'period': ['1700-1749', '1750-1759', '1760-1769', '1770-1779',
               '1780-1789', '1790-1799', '1800-1809', '1810-1819',
               '1820-1829', '1830-1839', '1840-1849', '1850-1859'],
    'patents': [92, 92, 205, 294, 477, 647, 924, 1323,
                1453, 2453, 4581, 6909]
}

df_patents = pd.DataFrame(uk_patents)
periods_numeric = np.arange(len(df_patents))
log_patents = np.log(df_patents['patents'])

# Linear fit on log values -> exponential growth parameters
slope, intercept = np.polyfit(periods_numeric, log_patents, 1)
# -> Exponential growth rate: ~25% per decade
# -> Doubling period: ~30 years (patents double every 30 years)
# -> From 92 to 6,909 = 75x over 160 years
The fit reveals a near-perfect exponential growth curve:
The pattern of innovation:
Patent applications follow near-perfect exponential growth.
Growth rate of roughly 25% per decade. Doubling period of thirty years.
But key inventions are not uniformly distributed:
– 1760s-1770s: The textile machinery revolution (spinning jenny, Watt’s steam engine)
– 1780s-1790s: Power applications (power loom, cotton gin)
– 1800s-1820s: The transport revolution (steamship, railway)
– 1830s-1850s: Communications and materials (telegraph, Bessemer steel process)
Innovation is cumulative, not isolated.
Watt’s steam engine built on Newcomen’s. The railway built on the steam engine. The telegraph built on decades of electrical research.
Every invention stands on the shoulders of its predecessors.
This is Mokyr’s central insight: what distinguished Britain was not any single breakthrough, but an “Industrial Enlightenment” — a culture of incremental improvement, of tinkering and sharing, that turned isolated sparks of genius into a self-sustaining chain reaction of innovation.
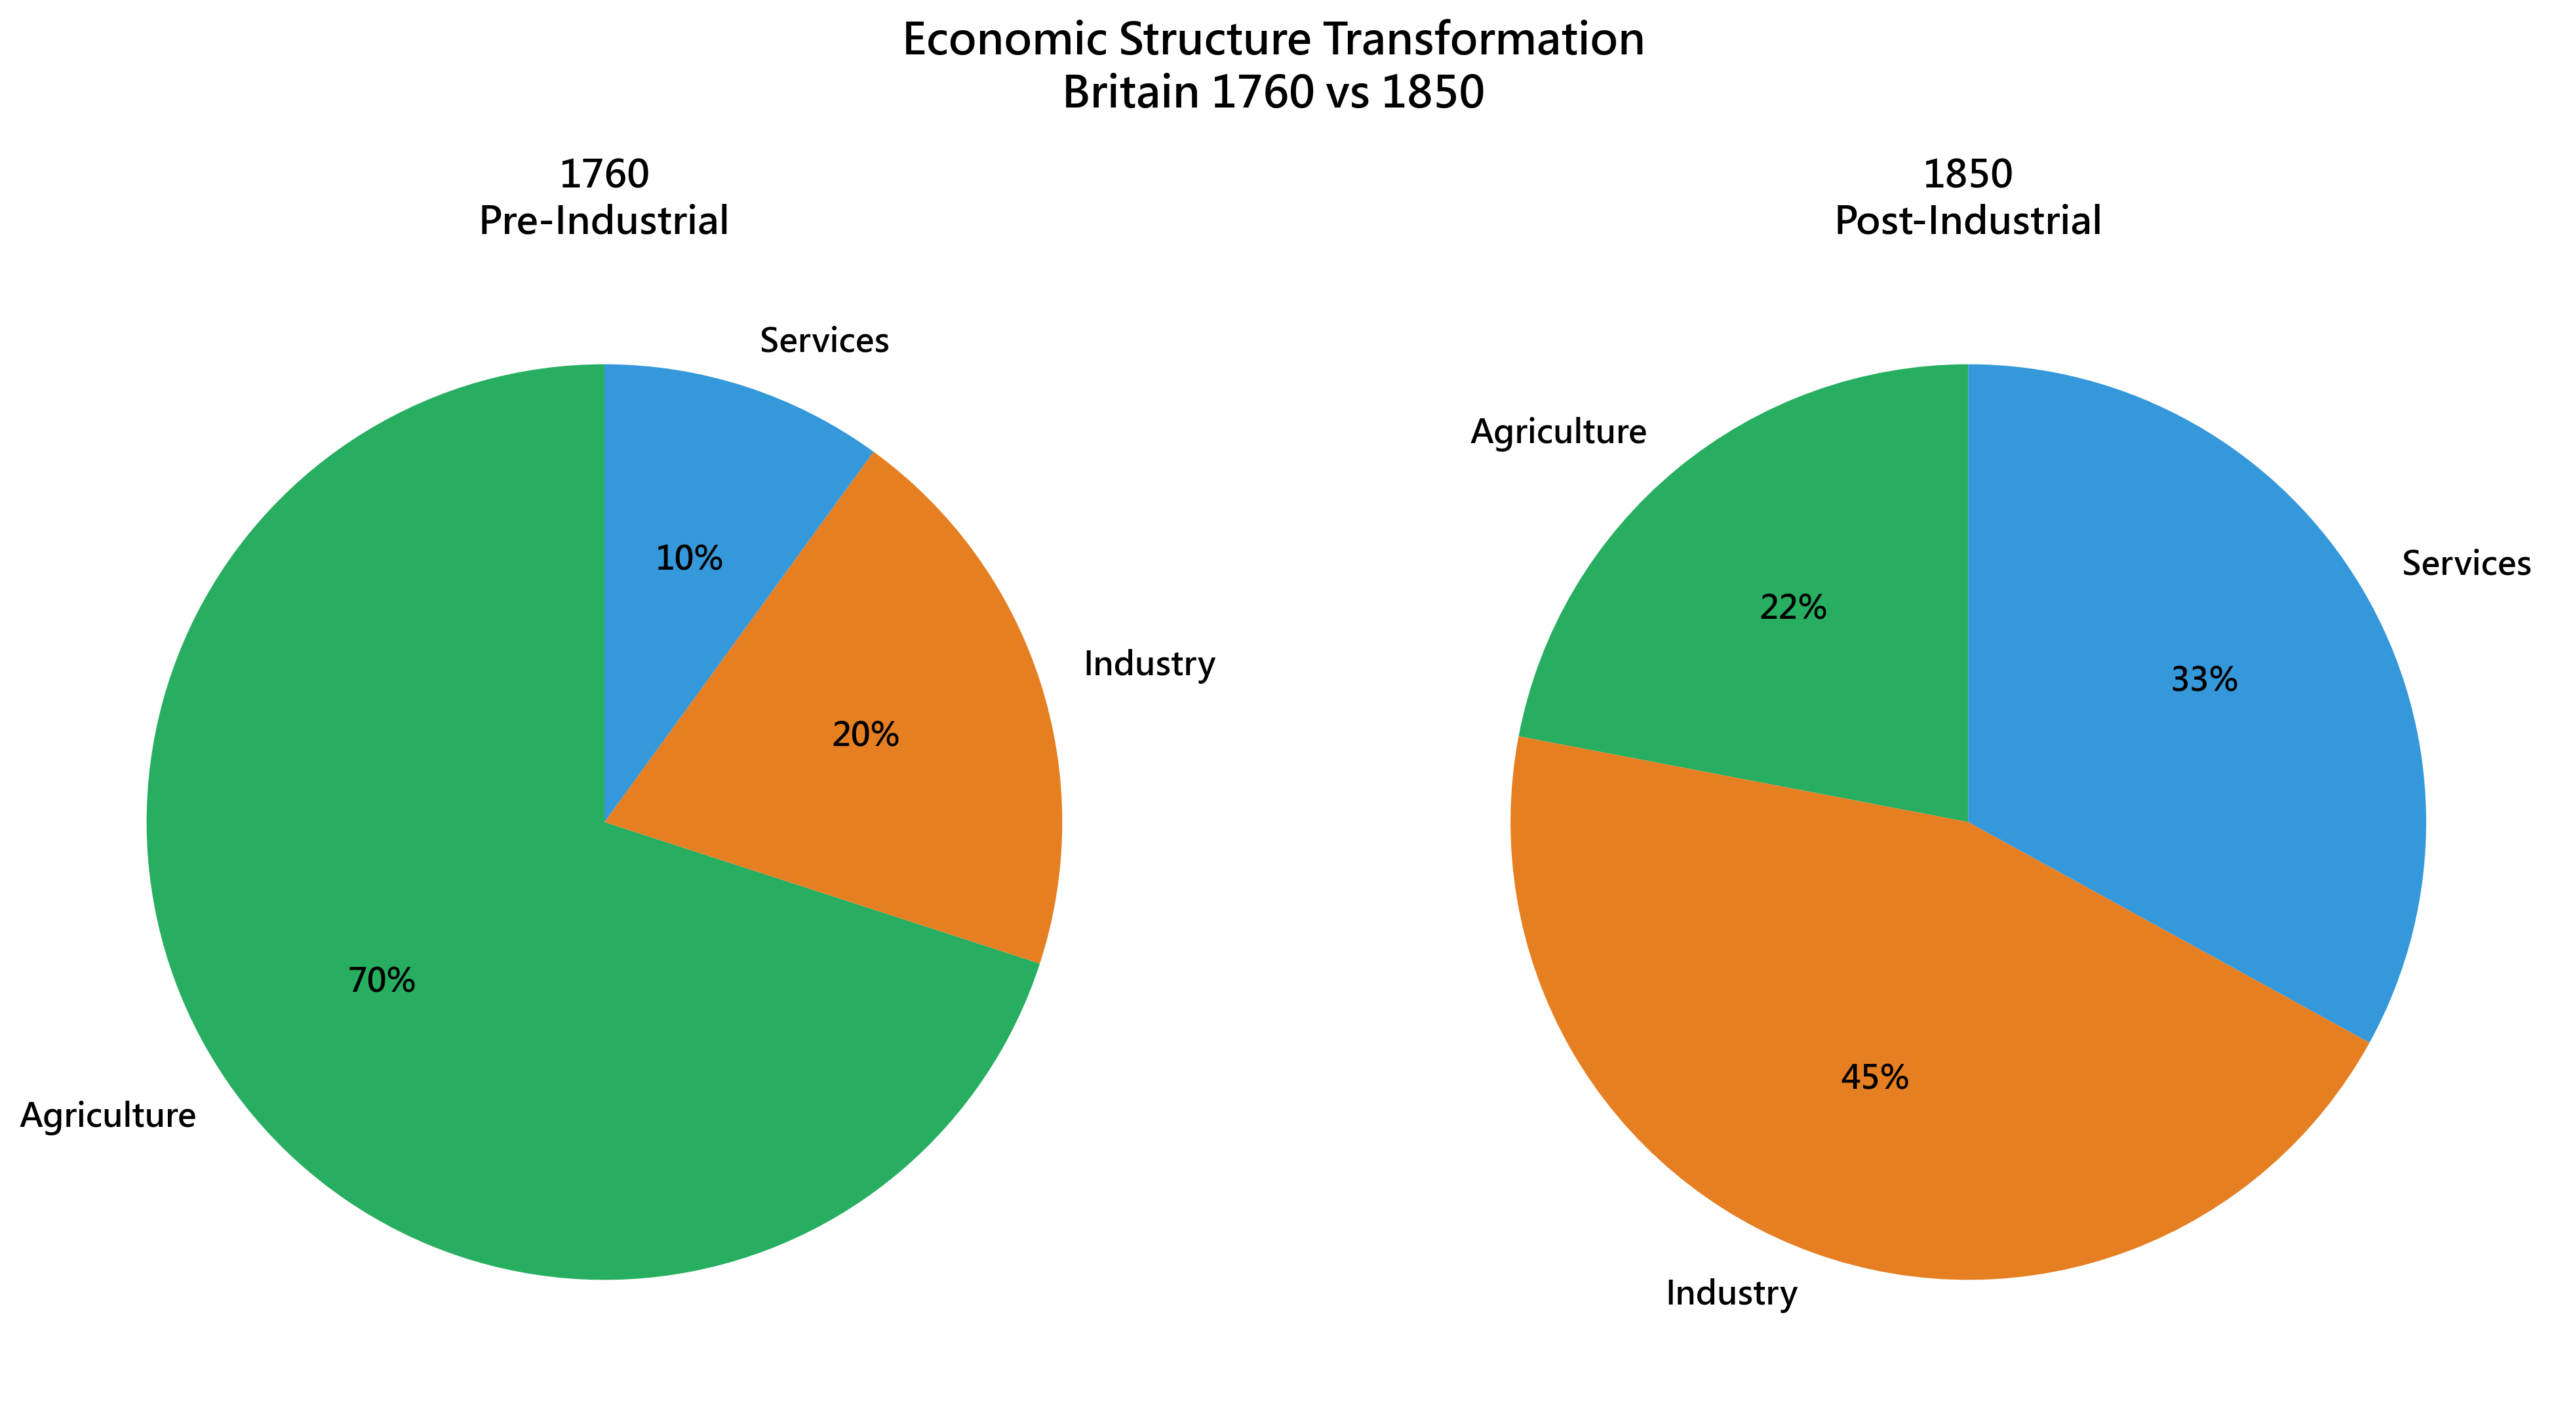
The Fourth Question: When Did Industrial Structure Transform?
The Industrial Revolution was, at its core, a shift from agriculture to industry.
But when was it complete?
We use British labour force distribution data (1700-1880) to construct stacked area charts, tracking the rise and fall of agriculture, industry, and services, and calculating the rate of structural transformation in each period.
The truth about structural transformation:
It was not overnight. It was 180 years of incremental change.
Key turning points:
– 1760: Agriculture drops below 50% for the first time
– 1800: Industry overtakes agriculture
– 1840: Agriculture falls below 25%
But even by 1880, 12% of the workforce was still on the land.
The persistence of agriculture alongside industrial growth is one of the most underappreciated features of the British transformation. Crafts and Harley showed that the “modern” sectors — cotton textiles, iron, steam power — were remarkably concentrated, while vast stretches of the economy continued much as before. The revolution was real, but it was also patchy.
The Fifth Question: When Did Trade Go Global?
The Industrial Revolution drove the first great wave of globalisation.
But what was the scale?
We collect British foreign trade data from 1700 to 1850 — exports, imports, total trade volume, and trade as a share of GDP — and track the evolution of export composition (textiles rising from 10% to 60%) and import composition (raw cotton surging from 5% to 35%).
The story of trade:
The Industrial Revolution powered the “first globalisation.”
Britain’s role:
– Exports: Manufactured goods (textiles, metalwork, machinery)
– Imports: Raw materials (cotton, wool, timber) and food
This was the economic foundation of empire:
– Colonies supplied raw materials
– Britain processed them into finished goods
– And sold them back to the colonies
The cotton trade alone tells the story of an entire world system. Raw cotton from the American South and India flowed into Lancashire mills. Finished cloth flowed out to markets in Africa, Asia, and Latin America. The numbers — a 14x increase in trade volume over 150 years — are the quantitative footprint of an economic order that reshaped continents.
Synthesis: Revolution or Evolution?
We have analysed five dimensions of data:
| Indicator | Start Year | Completion Year | Duration |
|---|---|---|---|
| GDP doubling | 1760 | 1850 | 90 years |
| 50% urbanisation | 1700 | 1870 | 170 years |
| Industry overtakes agriculture | 1760 | 1800 | 40 years |
| Patent doubling | Every 30 years | — | — |
| Trade volume doubling | Every 40 years | — | — |
The answer: both revolution and evolution.
From the perspective of a single life: revolution.
– A person born in 1780 who lived to 1860
– They witnessed: cottage industry to factory, horse to railway, oil lamp to gas light
– Their world was turned upside down
From the perspective of data: evolution.
– GDP did not jump from 1% to 10%; it accelerated gradually
– Urbanisation was not overnight; it was a 200-year process
– Innovation did not erupt suddenly; it compounded exponentially
The crucial insight:
Transformative change feels slow while it is happening. Only in retrospect does it appear sudden.
Modern Implications: Where Are We in the Digital Revolution?
If the Industrial Revolution took eighty to a hundred years to become “revolutionary,” what about the Digital Revolution?
Let us draw the comparison:
| Stage | Industrial Revolution | Digital Revolution | Key Event (Industrial) | Key Event (Digital) |
|---|---|---|---|---|
| Invention | 1712-1760 (48 yrs) | 1940-1980 (40 yrs) | Newcomen engine (1712) | ENIAC (1945) |
| Commercialisation | 1760-1780 (20 yrs) | 1980-2000 (20 yrs) | Watt’s improvement (1769) | PC revolution (1980s) |
| Early diffusion | 1780-1800 (20 yrs) | 2000-2010 (10 yrs) | Factory system | Internet adoption |
| Rapid growth | 1800-1840 (40 yrs) | 2010-present (14+ yrs) | Railway networks | Cloud / mobile |
| Maturity | 1840-1880 (40 yrs) | Future | Telegraph / telephone | AI? |
| Saturation | 1880+ (ongoing) | ? | Electrification | ? |
Several questions worth pondering:
When does the Digital Revolution begin? If we date it from 1980 (the PC going mainstream), we are now 44 years in — corresponding roughly to 1804 in Industrial Revolution terms, squarely in the rapid-growth phase. If we date it from 1990 (the commercialisation of the internet), we are only 34 years in — corresponding to 1794, still in early diffusion.
Is AI “Digital Revolution 2.0” or the “Fourth Industrial Revolution”? The gap from steam to electricity was 111 years (1769 to 1880). The gap from the internet to AI was only 33 years (1990 to 2023). The pace has accelerated 3.4 times.
When will the Digital Revolution be “complete”? The Industrial Revolution took roughly 120 years (1760-1880) to run its course. If the Digital Revolution follows a similar arc from 1990, we might expect completion around 2040-2050. But Moore’s Law means we may compress a century of transformation into fifty or sixty years.
We use a Bass diffusion model and historical analogy to estimate the completion trajectory of both revolutions:
The striking conclusion:
If the Digital Revolution follows the Industrial Revolution’s pattern, we are currently at roughly:
60-65% completion
Analogous to the 1840s of the Industrial Revolution:
– Core technologies have matured (internet, smartphones, cloud)
– Mass adoption is underway
– But we have not yet reached saturation
– Major innovations remain ahead (AI, quantum computing)
But there is a crucial difference:
The Digital Revolution is moving 3 to 5 times faster than the Industrial Revolution.
What the Industrial Revolution accomplished in 120 years, the Digital Revolution may achieve in 40 to 50.
So:
– Industrial Revolution: 1760-1880 (120 years)
– Digital Revolution: 1980-2030? (50 years)
This means the next five to ten years may be the most intense period of transformation.
The Final Question: Can History Predict the Future?
History does not repeat, but it rhymes.
What does the Industrial Revolution teach us?
- Transformative change takes time
- Not five or ten years, but fifty or a hundred
- We overestimate short-term impact and underestimate long-term impact
-
This is Amara’s Law, and every data point in our analysis confirms it
-
Change is not linear
- There are phases of acceleration, plateaus, and saturation
- Early growth is slow; later growth is explosive
-
The S-curve, not the straight line, is the shape of revolution
-
Infrastructure determines speed
- Canals to railways: the Industrial Revolution accelerates
- Fibre optics to 5G: the Digital Revolution accelerates
-
In both cases, the enabling infrastructure preceded the transformation it enabled
-
Society adapts more slowly than technology
- Technology diffuses in a decade; legislation catches up in fifty years
- The Factory Act of 1833 came 73 years after the Industrial Revolution began
- GDPR came 28 years after the internet went commercial
-
The lag is shorter now, but it still exists
-
Every revolution creates winners and losers
- Industrial Revolution: artisans displaced by factory workers
- Digital Revolution: bricks-and-mortar retail displaced by e-commerce
- The gains are diffuse; the losses are concentrated and personal
The deepest insight:
We never know where we stand in history. Only looking back can we tell whether we were at the beginning or the end.
In 1851, Queen Victoria stood in the Crystal Palace and believed the Industrial Revolution was complete.
Sixty years of transformation still lay ahead — electricity, the automobile, the aeroplane.
Today, we stand at the dawn of the AI era and assume the Digital Revolution is nearly finished.
In truth, twenty to thirty years of upheaval may still lie before us.
Conclusion: Data Does Not Lie, But It Can Be Misread
We used Python to analyse economic data spanning 1700 to 1860.
The data tells us:
- The Industrial Revolution was not sudden; it was gradual
- GDP, population, and patents all followed exponential growth
- But each indicator operated on a different timeline
- From “beginning” to “completion” took 120 years
The data also warns us:
In the midst of transformation, we cannot see the full picture.
People in 1800 thought the Industrial Revolution had just begun. (It was already forty years old.)
People in 1850 thought it was over. (It had sixty years to run.)
In 2024, we face the same blindness.
We do not know:
– When did the Digital Revolution begin? (1945? 1980? 1990?)
– What stage are we in? (60%? 80%?)
– When will it be “complete”? (2030? 2050?)
But we know one thing:
The law of history: transformative change is slower than we imagine, but ultimately more thorough than we can conceive.
The Industrial Revolution took a century, but it changed everything.
The Digital Revolution may take only fifty years, but it will change everything too.
The question is: are we ready?
Afterword: Standing in the Reflection of the Crystal Palace
Having finished this article, I find myself returning to Victoria’s exclamation in the Crystal Palace.
It was 1851. The Industrial Revolution had been underway for nearly a century. The steam engine had evolved from Newcomen’s lumbering mine pump into the beating heart of a global empire. Manchester had swollen from a market town of 18,000 into an industrial colossus of 316,000. Patent applications were doubling every thirty years, and the compound interest of knowledge was rewriting the equations of civilisation. The Queen stood in that cathedral of glass and iron, surveyed 13,000 exhibits, and concluded that the world had been fundamentally transformed.
She was wrong — not because her observation was inaccurate, but because no one living inside a transformation can see where they stand on the curve. After 1851, electricity, the automobile, the aeroplane, and the telephone were all still to come, each one destined to make the Crystal Palace exhibits look like relics from a vanished age.
This is perhaps the most fascinating and most unsettling discovery of data archaeology. We analysed five dimensions of economic data — GDP, urbanisation, patents, industrial structure, trade — and every dataset pointed to the same conclusion: what we call a “revolution” was actually a long evolution, and the people living through it never knew they were being rewritten by history.
If you lead a business, this means you should not expect a “sudden revolution” but prepare for “continuous evolution.” History shows that structural transformation takes twenty to thirty years, not two or three. Investing in future technologies is important, but neglecting your existing operations may mean you do not survive long enough to see the future arrive.
If you make policy, the lessons of the coal age could not be clearer: infrastructure needs to be planned twenty years in advance, and social safety nets need to be built before they are needed. The Factory Act of 1833 came too late — countless children had already lived and died beside the spinning frames. Digital-age regulation cannot afford to repeat that mistake.
If you are young, you will likely witness the “completion” of the Digital Revolution — if our analogy holds, that is roughly 2040 to 2050. This means your career will span the most intense phase of the transformation. Lifelong learning is a cliche but an unavoidable reality. More important, perhaps, is to pay attention to what does not change amid the technological turbulence — the fundamental needs of human beings, the deep structures of society, the patterns that history keeps repeating.
The Industrial Revolution tells us that transformation is a marathon, not a sprint. We are probably around kilometre thirty-five — still some distance from the finish, though the hardest climb may be behind us. Or it may not.
That is history’s most honest answer: I do not know. But I can tell you what happened before.
Deep Dive: Complete Analysis Pack
This article shared data archaeology across five dimensions — GDP time series, the urbanisation explosion, exponential patent growth, industrial structure transformation, and trade globalisation — to reconstruct the true trajectory of the Industrial Revolution. The complete analysis pack goes further:
- GDP structural breakpoint detection: Statistical methods automatically identify turning-point years in economic growth; results show significant breaks in the 1790s and 1820s — diverging from the traditional “1760 starting point” narrative
- Six industrial cities, 150-year population trajectories: Year-by-year interpolated urban growth animations revealing that the growth rhythms of Manchester and Liverpool differ in ways more complex than summary tables suggest
- Patent innovation network analysis: Using NetworkX to construct cross-industry innovation linkage graphs; steam engine and energy-related patents form the central nodes of the entire network, quantifying the degree to which each invention “stood on the shoulders” of its predecessors
- Colonial trade overlay analysis: Behind the 80x surge in raw cotton imports lies the full quantitative footprint of the colonial economic structure
- ~400 lines of teaching-grade Python code with detailed English comments, 11 advanced visualisations (PNG 300dpi)
Get the Article 04 Deep Dive Pack ->
Next in the Series
- Yorkshire, England. Eight-year-old Sarah spent her days hauling coal trucks through pitch-black tunnels, fourteen hours at a stretch. A hundred and seventy-six years later, Amazon’s AI hiring system was quietly rejecting every female applicant’s resume.
Why is the cost of technological progress always borne by the most vulnerable? Between the lament of the child labourer and the bias of the algorithm lies a structural resemblance that is deeply uncomfortable. In the series finale, we use fairness metrics to quantify an injustice that spans two centuries.
References
- Maddison, A. (2007). Contours of the World Economy, 1-2030 AD. Oxford University Press.
- Mitchell, B. R. (1988). British Historical Statistics. Cambridge University Press.
- Allen, R. C. (2009). The British Industrial Revolution in Global Perspective. Cambridge University Press.
- Wrigley, E. A. (2010). Energy and the English Industrial Revolution. Cambridge University Press.
- Crafts, N. F. R. (1985). British Economic Growth during the Industrial Revolution. Oxford University Press.
- Mokyr, J. (2009). The Enlightened Economy: An Economic History of Britain 1700-1850. Yale University Press.
- Broadberry, S. et al. (2015). British Economic Growth, 1270-1870. Cambridge University Press.
Further reading: The data analysis methods used in this article — time series structural breakpoint detection, Gini coefficients, Lorenz curves — will be applied to analyse the formation and collapse of asset bubbles in the “Finance, Bubbles & Crises” series.
About Code & Cogito
Decoding history through code. Understanding philosophy through data.
Newsletter — codecogito.com/subscribe
GitHub — Code-and-Cogito/code-cogito-public
Written by: Wina
Series: Industrial Revolution & Data Revolution #04/05
Tags: Data Archaeology, GDP Analysis, Urbanisation, Industrial Structure, Patent Networks, Python
(c) 2025 Code & Cogito. CC BY-NC-SA 4.0